
The 7-Year Itch, Lockdown Weddings and Who Files First: What the Latest Divorce Data Really Shows
How many couples divorce each year, who applies, and when are marriages most likely to break down? To find out, researchers at Stephen Rimmer Solicitors analysed the latest Office for National Statistics (ONS) divorce figures for England and Wales.
Divorce affects more than 100,000 couples in England and Wales every year, and often their children and wider families too. With no-fault divorce now changing how couples separate, understanding when and how marriages end matters more than ever. Knowing where the pressure points lie can help couples recognise problems earlier and get the right advice before decisions are made in a crisis.
The data shows that divorce numbers have held steady, with 105,002 divorces in 2025. Women continue to make most sole divorce applications, even after the introduction of no-fault divorce. The “7-year itch” appears to be real, with the seventh year of marriage the most common point for divorce in 2025. Couples who married during lockdown are divorcing faster than those who married before the pandemic, and same-sex divorces rose by 12% in a year.
Below, we look at each finding in turn, along with our family team’s view on what might lie behind them.
How Did We Conduct the Study?
We analysed ONS divorce statistics by length of marriage, sex of applicant, year of marriage and partnership type. Our focus was on the most recent data (2025), with comparisons to earlier years where changes were significant. We also drew on the experience of our family team to explore possible reasons behind the trends.
The Overall Picture
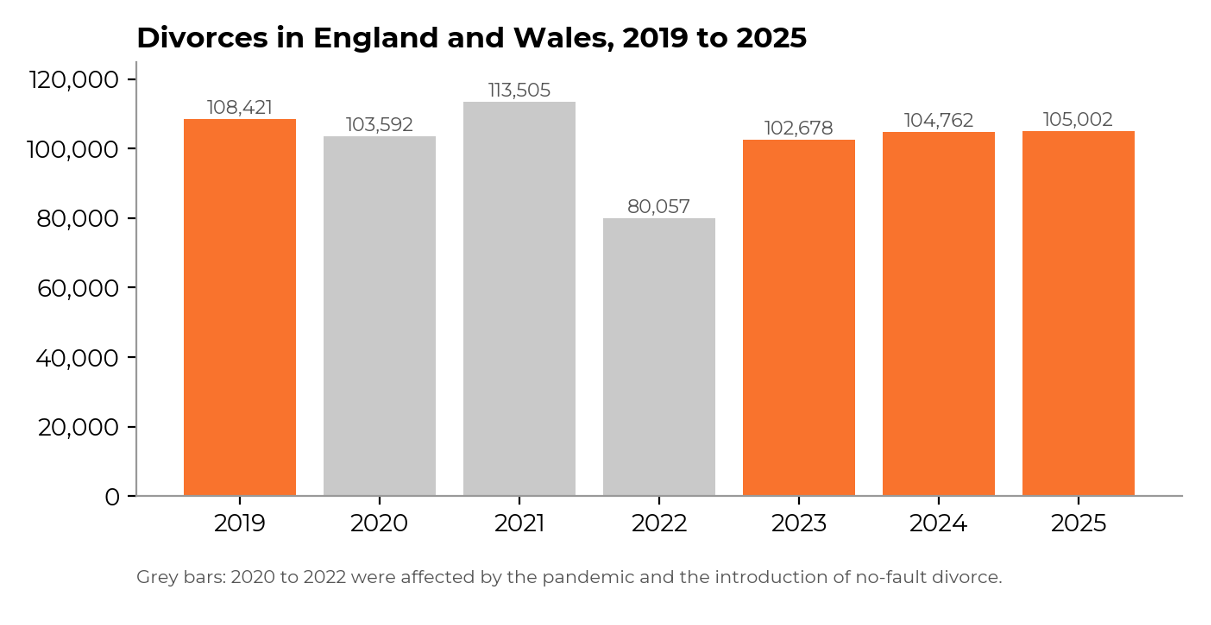
Latest ONS figures show there were 105,002 divorces in England and Wales in 2025, almost unchanged on 2024 (104,762), with a divorce rate of 8.5 per 1,000 married people. This is the same rate as 2024 and remains below the pre-pandemic level of 9.0 in 2019.
Source: Office for National Statistics (ONS)
Divorce numbers have been broadly stable since 2023, when there were 102,678. The years 2020 to 2022 were unusual, as the pandemic affected how and when divorces were processed and no-fault divorce, introduced in 2022, changed how couples apply. This caused sharp swings, including a dip to 80,057 divorces in 2022.
Women Make Most Sole Divorce Applications
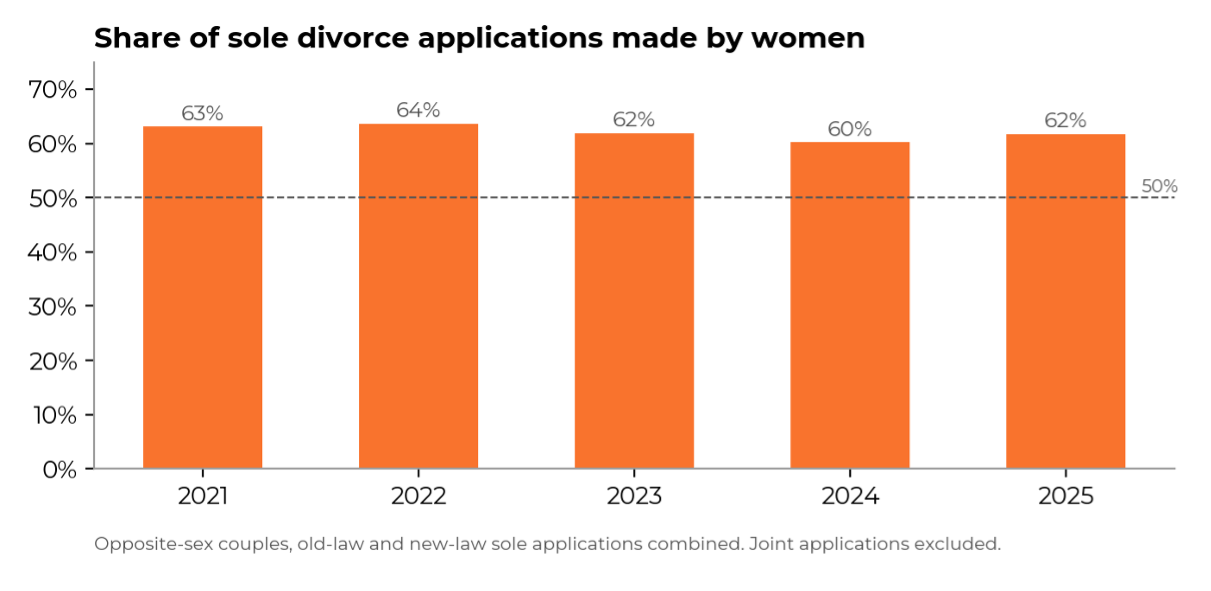
Among opposite-sex couples, women are behind more than three in five sole divorce applications. In 2025, women made 48,096 and men 27,429, out of 77,895 in total, including 2,370 with no recorded sex. That is 62% by women, or 1.75 applications for every one made by men.
Source: Office for National Statistics (ONS)
Women made between 60% and 64% of sole applications each year from 2021 to 2025, or between 1.70 and 1.75 for every one by men. No-fault divorce has not changed this: the ratio was 1.71 in 2021, the last full year under the old law, and 1.75 in 2025.
The old fault-based system is now almost gone. Only 5,760 opposite-sex divorces in 2025 were granted under the old law, down from 11,026 in 2024 and 25,986 in 2023, compared with 96,821 under the new law.
It’s important to remember that the data shows who applied for divorce, not who wanted it or why.
Joint Applications Remain the Minority
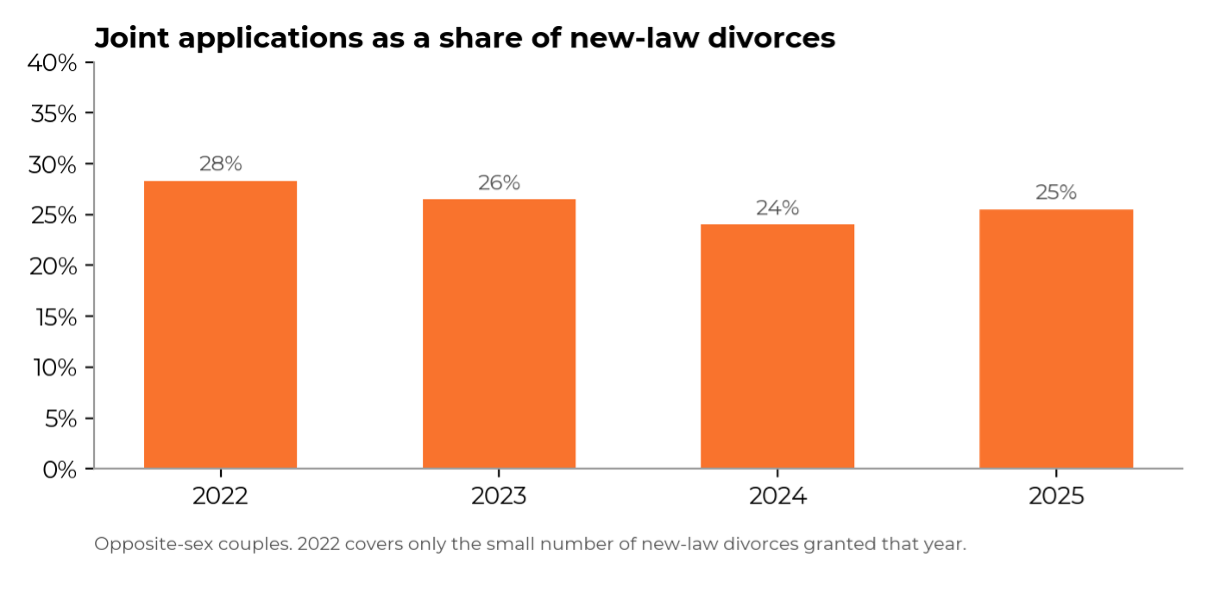
Joint applications, introduced with no-fault divorce, remain far less common than sole ones. In 2025, 24,686 of the 96,821 opposite-sex new-law divorces (25%) were joint applications. The share has stayed at around a quarter since the new law began: 28% in 2022, 26% in 2023, 24% in 2024 and 25% in 2025.
Source: Office for National Statistics (ONS)
Why Might More Women Apply?
This is a long-standing pattern. ONS figures show that wives have filed most opposite-sex divorce petitions in England and Wales every year since 1949, with the share peaking at 72% in 1992.
Reflecting on the possible reasons for this, Ben Bradshaw, Partner and Head of the Family Department at Stephen Rimmer Solicitors, said:
“By the time someone comes to us to start a divorce, the problems have usually been building for a long time. Women are often the ones who have been carrying more at home, whether that’s childcare, running the household or worrying about money, and when one person bears the brunt of that for years, it’s understandable that they may be the one to take the first step.
“It’s important to remember, though, that the figures only show who applied. Many decisions to separate are reached together, even when only one person makes the application.”
Regarding the figures surrounding joint applications, Ben commented:
“A joint application can work well where a couple have reached the decision together and can still communicate, but it needs both people to agree and to confirm each step along the way.
“Applying jointly isn’t any quicker, and if one person stops engaging, the other may need to continue on their own. For many separating couples, especially where emotions are running high, a sole application is simply the more practical route.”
Is the 7-Year Itch Real?
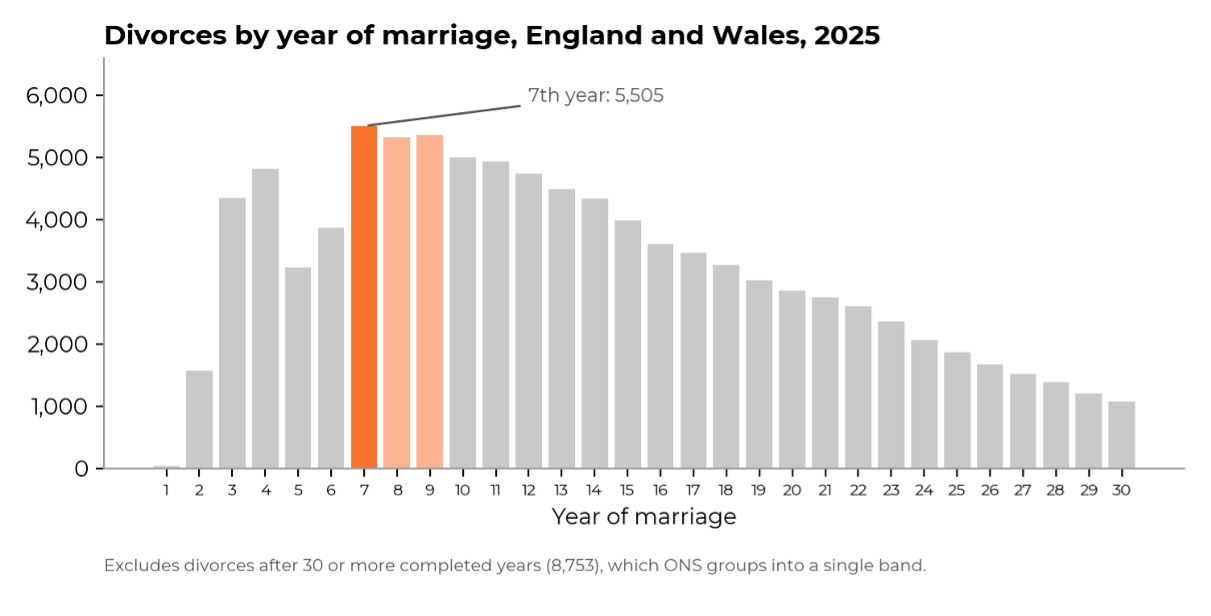
The data suggests it is. In 2025, 5,505 couples divorced in their seventh year of marriage, making it the most common year for divorce and accounting for 5.2% of all divorces.
Source: Office for National Statistics (ONS)
However, the seventh year was only narrowly ahead of the ninth (5,358) and eighth (5,328), pointing to a window of risk rather than a spike. Together, these three years accounted for 16,191 divorces in 2025 (15.4%), and they have been the three most common points for divorce in every year from 2021 to 2025. The single most common year moves around within that window:
| Year | Most common year of marriage for divorce | Divorces |
|---|---|---|
| 2025 | Seventh year | 5,505 |
| 2024 | Eighth year | 5,585 |
| 2023 | Seventh year | 5,672 |
| 2022 | Eighth year | 4,289 |
| 2021 | Ninth year | 6,283 |
Furthermore, 8,753 divorces in 2025 (8.3%) came after 30 or more years of marriage, a reminder that long marriages end too.
Why Might the Seventh to Ninth Years Be a Turning Point?
The data shows when couples divorce, not why, so Ben has reflected on the possible reasons.
He said:
“The seventh to ninth years are often when the excitement of the early years has worn off and day-to-day pressures have built up. Many couples will have young children by then, which can put real strain on a relationship, particularly if one person feels they are carrying more of the load.
“Most marriages don’t end because of one dramatic event. More often, couples have gradually grown apart, or the same arguments keep coming back, and by this point some people feel they have tried for long enough.”
Lockdown Marriages Are Ending Faster
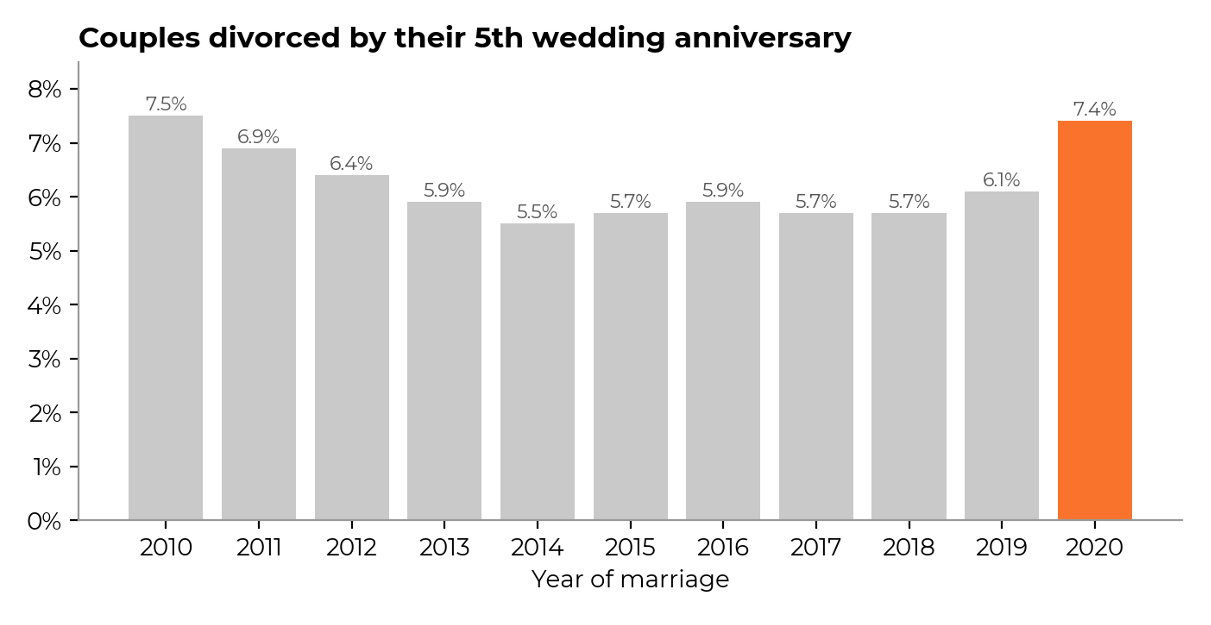
Couples who married during lockdown appear to be divorcing faster: by their fifth anniversary, 7.4% of couples who married in 2020 had divorced, or around 6,300 couples. This is the highest for any wedding year since 2010, when the figure was 7.5%.
Source: ONS estimates
That compares with 6.1% of couples who married in 2019, 5.9% of those who married in 2016 and 5.7% of those who married in 2015, 2017 and 2018. So lockdown couples are around 21% more likely to have divorced by their fifth anniversary than 2019 couples, and around 30% more likely than 2015, 2017 or 2018 couples.
The gap was visible a year earlier. By their fourth anniversary, 4.5% of 2020 couples had divorced, the highest for any wedding year since 2011, compared with 3.7% of 2018 and 2019 couples.
Far fewer couples married in 2020: just 85,770, because of lockdown restrictions, compared with 219,850 in 2019 and more than 230,000 a year between 2010 and 2018.
Why Might Lockdown Marriages Be Ending Sooner?
The data does not show why, but there are several possible reasons.
Ben said:
“Starting married life in a pandemic was a very unusual test. Many couples spent months together at home, juggling work, money worries and, for some, young children, without the usual support of family and friends. That pressure didn’t affect every couple in the same way, and some relationships grew stronger.
“But where someone was struggling with their mental health, or felt the work at home wasn’t being shared fairly, it could widen cracks that were already there. It’s also possible that some couples went ahead with their wedding quickly, or in very different circumstances from those they had planned, and found married life looked different once restrictions lifted.”
The ONS also notes that disruption to family courts during the pandemic may have affected when divorces were granted in later years.
Same-Sex Divorces Rise
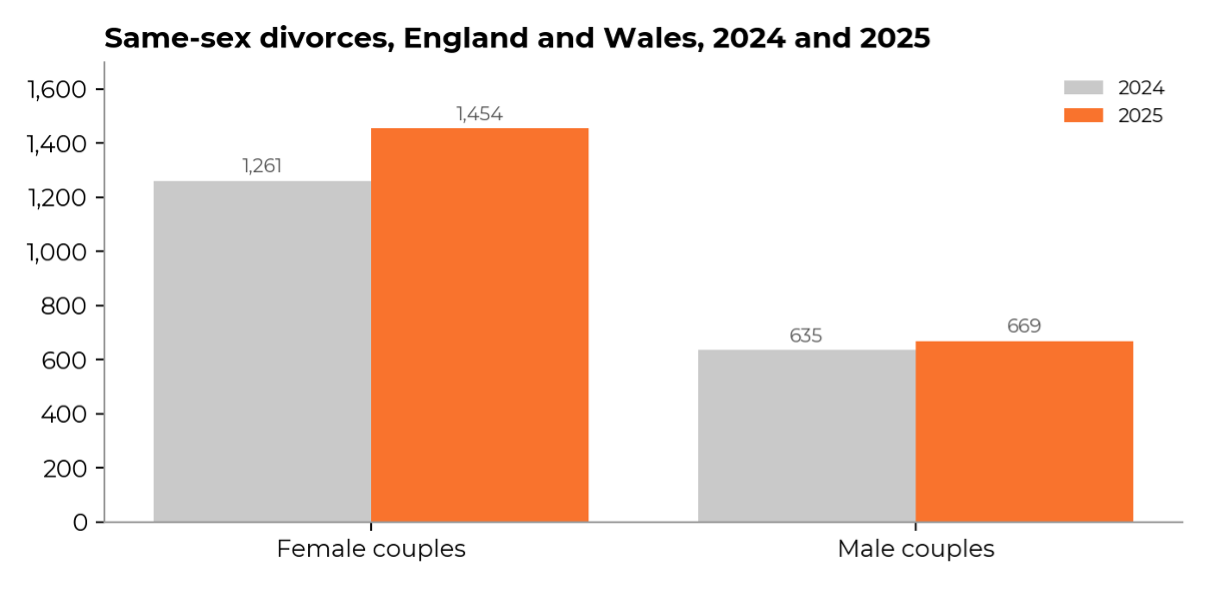
There were 2,123 same-sex divorces in England and Wales in 2025, up 12.0% from 1,896 in 2024, while opposite-sex divorces barely changed (102,879 compared with 102,866). Same-sex couples made up 2.0% of all divorces in 2025, up from 1.8% in 2024.
Source: Office for National Statistics (ONS)
Female couples accounted for 1,454 same-sex divorces in 2025 (68%), more than twice the 669 among male couples. Divorces among female couples rose by 15.3%, from 1,261, and among male couples by 5.4%, from 635. The numbers remain small compared with opposite-sex divorces.
What Is Behind the Rise?
The most likely explanation is that there are more married same-sex couples than ever. Same-sex marriage has only been possible in England and Wales since March 2014, and the ONS says the rise is expected, as the estimated number of people in same-sex marriages grew from 26,194 in 2015 to 218,204 in 2025, more than eightfold.
The pool has also grown through conversions. In 2015 alone, 9,156 same-sex couples converted a civil partnership into a marriage. The ONS says this is why some same-sex marriages ending in divorce appear to have lasted longer than same-sex marriage has been legal.
What 105,002 Divorces Tell Us
Divorce numbers may have settled at around 105,000 a year, but the detail tells a richer story. Women are still behind more than three in five sole applications, and no-fault divorce has done little to change that, with joint applications making up only around a quarter of new-law opposite-sex divorces.
The 7-year itch holds up, but the real danger zone runs from the seventh to the ninth year of marriage, a pattern that has repeated every year since 2021. Couples who married during lockdown are splitting up faster than those who married before the pandemic, while same-sex divorces rose by 12% as the number of married same-sex couples continues to grow.
Behind every one of these figures is a couple facing difficult decisions, which is why clear, early advice matters.
Thinking About Divorce? Get Clear Advice From the Start
Whether you are in your seventh year of marriage or your thirtieth, early advice can help you understand your options and plan your next steps.
At Stephen Rimmer Solicitors, our team provides clear, practical and sensitive support. If you are considering divorce, call us on 01323 644222, email enquiries@stephenrimmer.com, or visit our contact page to arrange a consultation.
Methodology
Our analysis uses the ONS’s latest release of Divorces and dissolutions in England and Wales, released 23 September 2026.
All divorce figures include same-sex couples but exclude civil partnership dissolutions. The ONS records the length of a marriage in completed years, which we have converted to year of marriage, so six completed years is the seventh year.
Figures on who applied cover opposite-sex sole applications under both the old and new law, and applications with no recorded sex are included in totals only. Joint application shares are for opposite-sex divorces under the new law.
Figures on couples divorced by their fourth and fifth anniversaries are ONS estimates, which assume that couples who married in England and Wales also divorced there. The 2025 divorce rate is based on married people aged 18 and over, following the rise in the minimum marriage age, while earlier years use those aged 16 and over.
The ONS data shows when and how couples divorce, but not why. Comments on possible reasons reflect the professional experience of our family team. The analysis is Stephen Rimmer Solicitors’ own.